Back to projects

Public sector / research and innovation

TA ČR: Designing an eGovernment system for three user groups

SISTA is an eGovernment portal for the Technology Agency of the Czech Republic with dozens of administrative processes, from registration to project scoring. I designed the UX process and design system for it, one that stays understandable even to people with very different experience.

TA ČR — Design Process

At a glance

Challenge

Three user groups shared one system with dozens of complex processes, screens were overloaded, and people without a technical background didn't know where they were or what to do next.

What I did

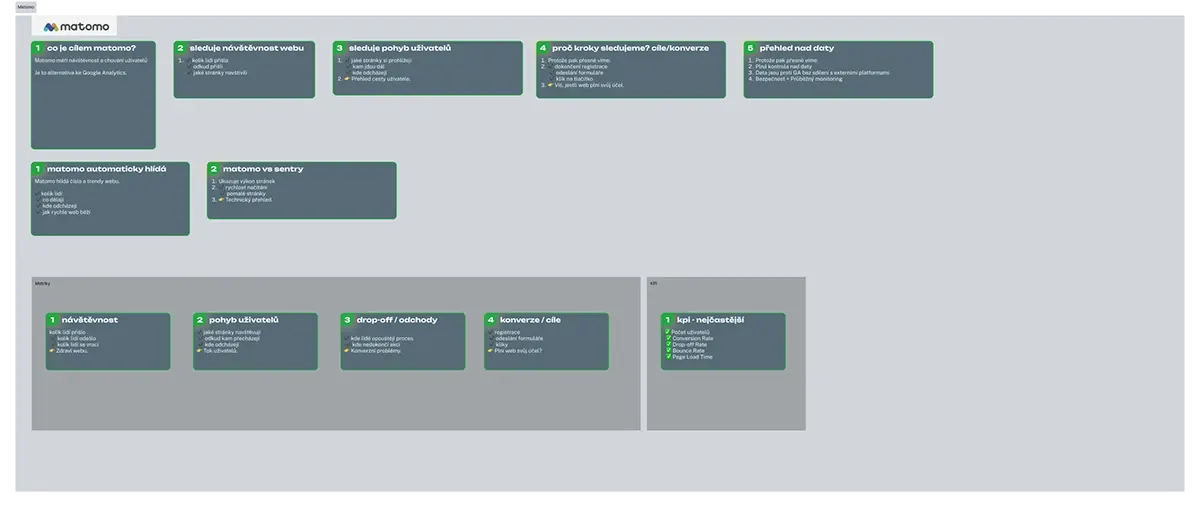
I ran a UX audit against Nielsen's heuristics, rebuilt the information architecture and main flows, connected Matomo and Sentry analytics, and built the DISTA UI Kit in Storybook.

Result

Onboarding personalised by user type, clearer scoring displayed in cards, and a unified DISTA UI Kit that cuts delivery time for new features in half.

Client

Technology Agency of the Czech Republic

Role

UX/UI Designer, design system

Year

05/2025 – ongoing

Tools

Figma, Storybook, Chromatic, Matomo, Sentry

TA ČR — Design Process — preview

In numbers

3

user groups in one system with dozens of processes

Matomo + Sentry

simpler issue traceability by linking them through session ID

3 → 1

Storybook, Figma and production in one source for faster delivery

Starting point

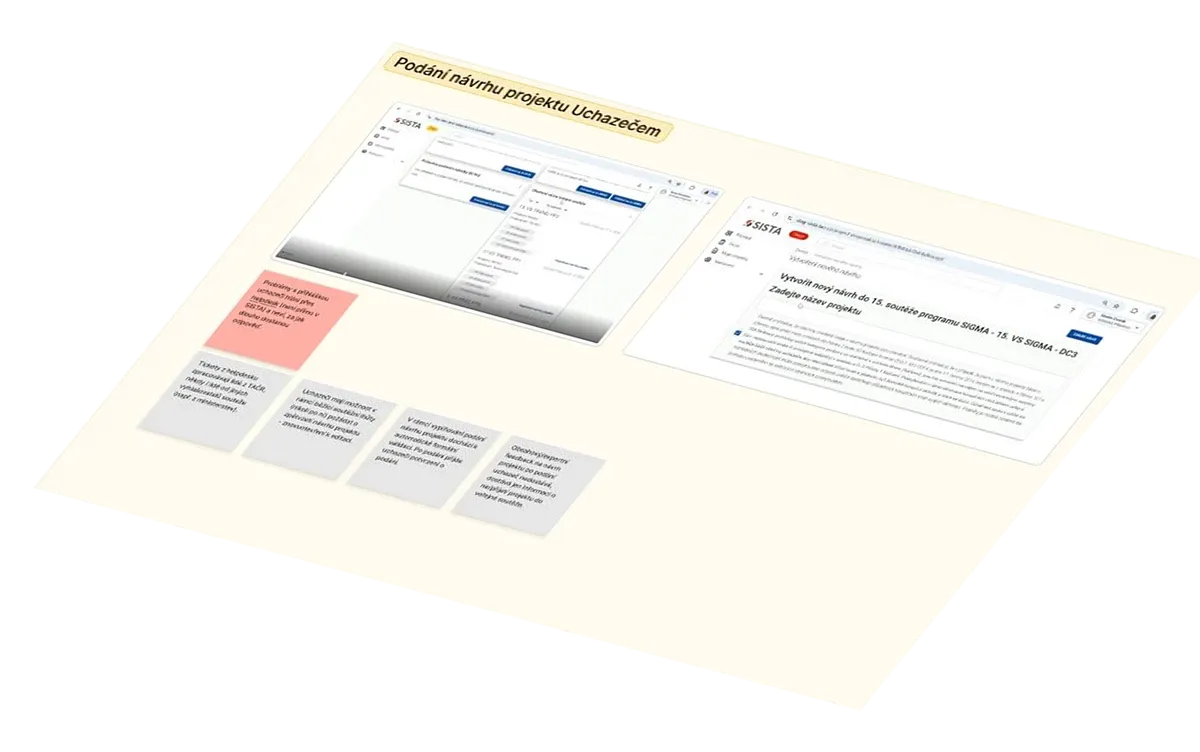
I joined a system that had grown for years based on technical requirements, not on how people actually work with it. I was responsible for both UX and the design system for three user groups at once, in collaboration with the Digital and Information Agency.

How I approached it

I started with a documentation review and a UX audit against Nielsen's heuristics. Then I rebuilt the information architecture and the main flows. We connected Matomo and Sentry via session ID, so for every issue we can see what the user did and where the system failed. Everything is built on the DISTA UI Kit.

Validation

Research as part of the collaboration was led by the Digital and Information Agency (DIA). Together, we used it to define concrete problems on the users' side, which became the basis for further design decisions.

Process

Key decisions

For each one: what the problem was, what I designed, and why.

01

Personalised onboarding and contextual help

The problem: Newcomers and experienced users got the same intro screen. Some got lost, others clicked through unnecessary steps. Users didn't know where they were in the process or what was expected of them.

Solution: Returning users see quick actions for items in progress, newcomers get a short video walkthrough and a clear first step. A dashboard with contextual help right at each step, and a sidebar that changes with the phase of the process.

Why: Each group needs something different at the start. One screen for everyone doesn't work for either of them. Help should live where the question arises — not in a PDF manual.
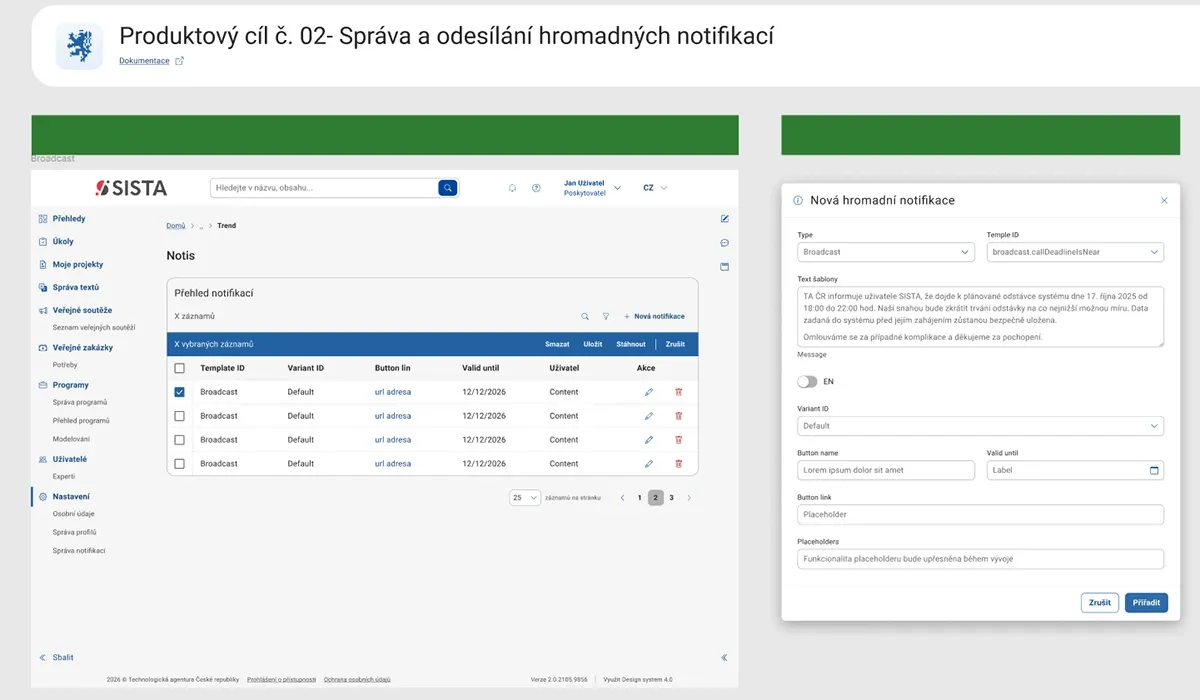
SISTA portal — managing and sending bulk notifications
02

Readable data and scoring in cards

The problem: Review results sat in long tables. Comparing two projects meant jumping between screens.

Solution: I turned the scoring report into cards that can be compared side by side, with a clear data hierarchy.

Why: Reviewers decide by comparing. With both in front of them, they decide faster and with fewer mistakes.

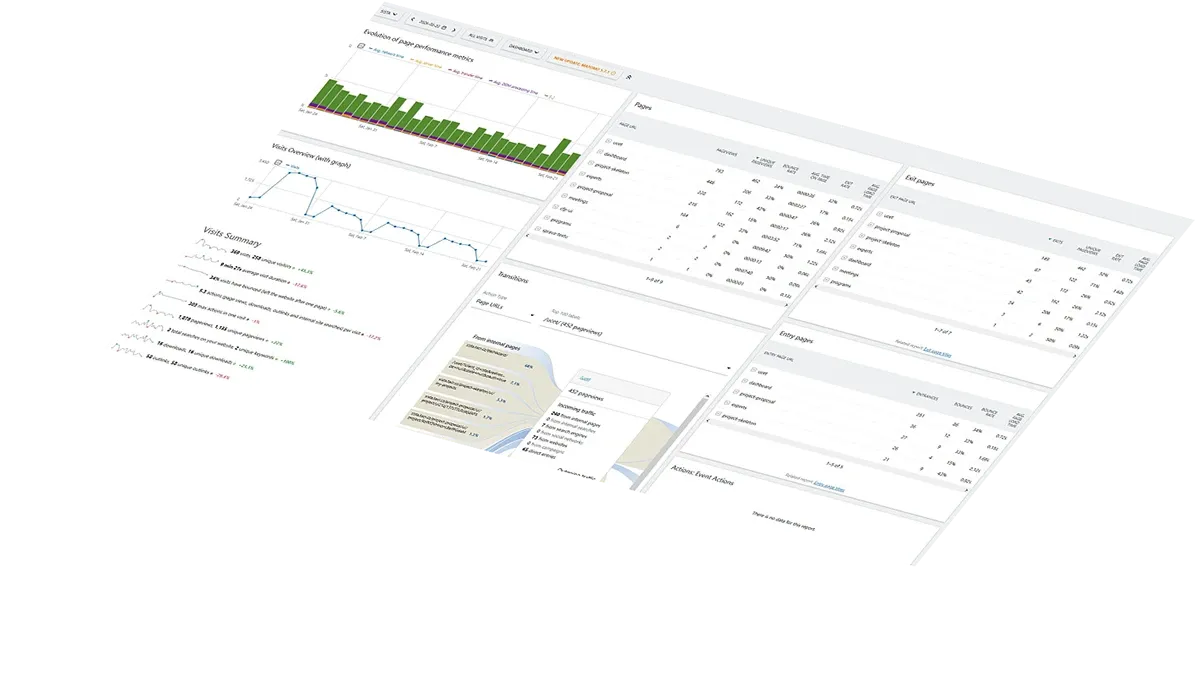
Analytics dashboard with SISTA portal traffic overview
03

DISTA UI Kit in Storybook

The problem: Every new screen was built from scratch, development was slow and the interface inconsistent.

Solution: I built the DISTA UI Kit with tokens and components in Figma, connected to Storybook for developers.

Why: One source of truth for design and code. New features are assembled from ready-made components and design patterns, so they ship in half the time compared with previous sprints. Specs are clearer for developers, and they know how to proceed.

Light and dark mode colour variables in the DISTA design system
TA ČR — Design Process — screenshots

Results

The collaboration produced a UX process that combines user needs, behavioural and technical data, a design system, and production monitoring. Specific problems can be tracked from first discovery through design to their behaviour in live operation.

The impact on support ticket volume and error rates is currently being evaluated as the system continues to roll out.

Gallery

More screens

Workshops, flows and the design system — what it looks like to work on a system used by thousands of people.

Full project on Behance
Workshop session with a personas and empathy map presentation for the TA ČR team
Workshop · personas and empathy map
Analytics dashboard with SISTA portal traffic overview
Analytics dashboard
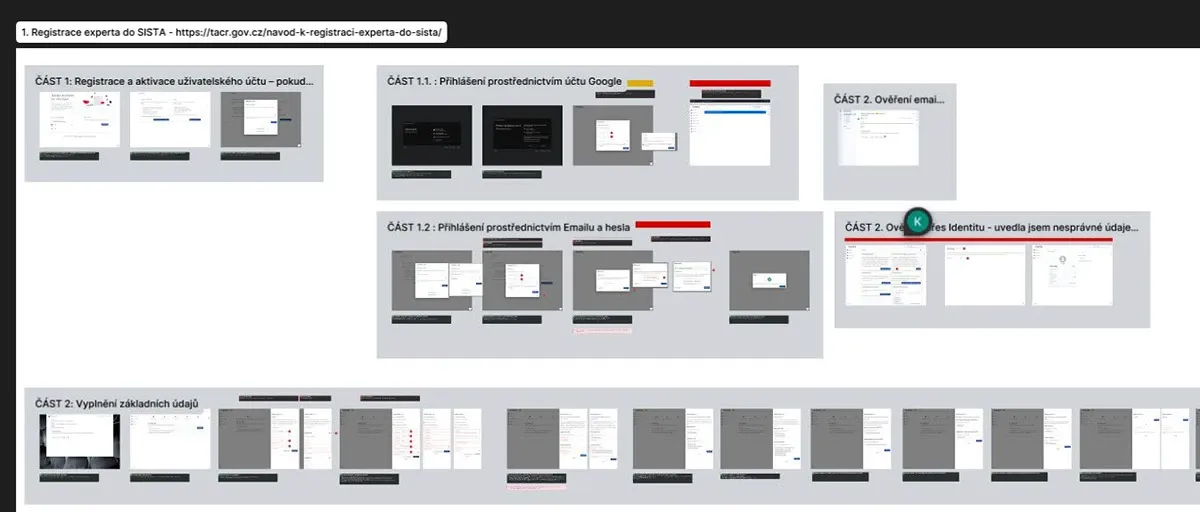
Figma flow map of expert registration on the SISTA portal
Flow · expert registration
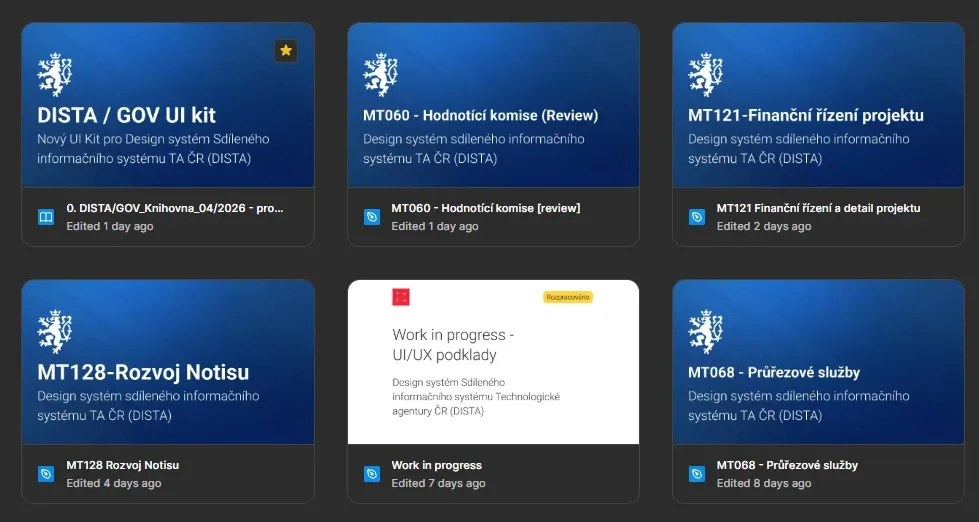
Overview of Figma files for the DISTA/GOV UI kit design system
DISTA/GOV UI kit · files
SISTA portal — managing and sending bulk notifications
Bulk notifications
Light and dark mode colour variables in the DISTA design system
Colour variables · light/dark
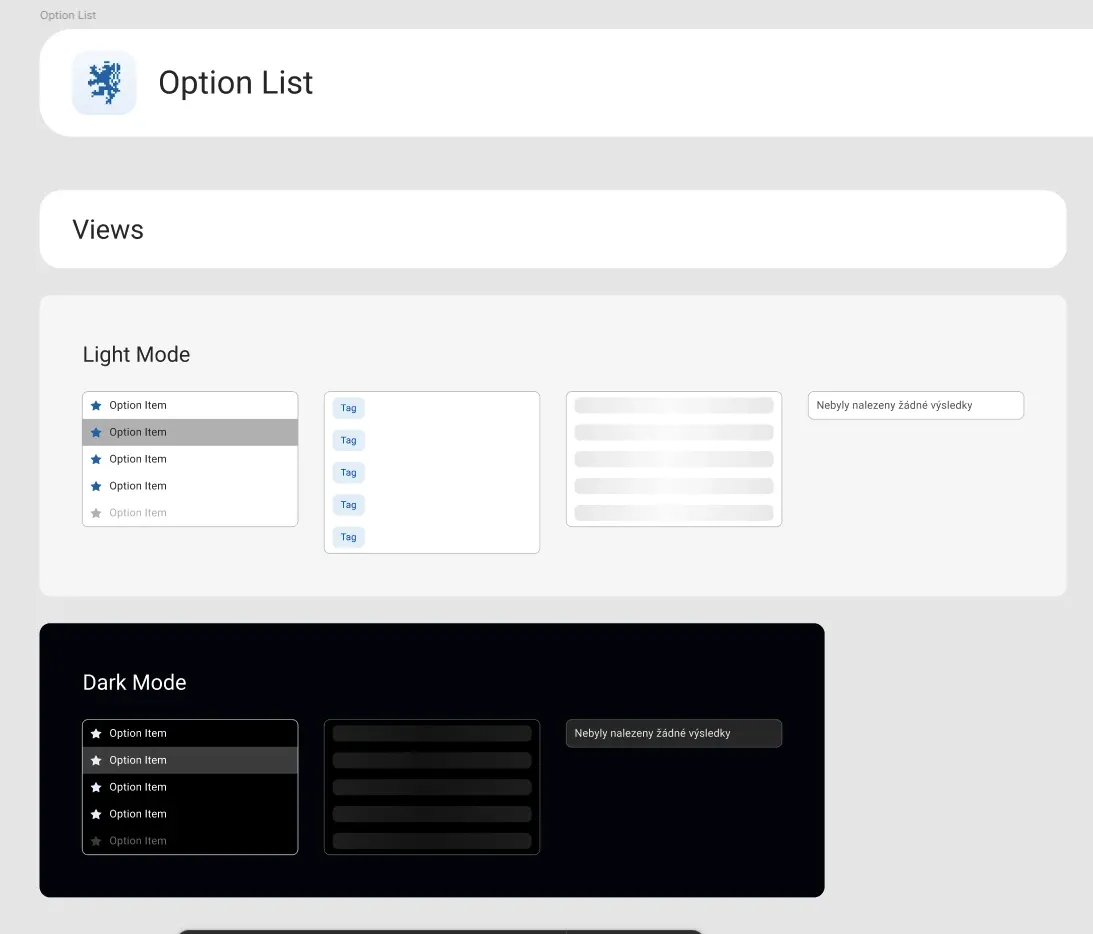
Option List component in light and dark mode
Component · light and dark mode
DISTA UI kit colour palette documentation in Storybook
Storybook · colour palette
“Throughout our collaboration we've had regular consultations, where we work through not just concrete processes and problems, but also new Figma features — increasingly often with the rise of AI. What I value most about Kristýna is her thoroughness and overview; she actively follows developments in this field.”

Anna Marie Neugebauerová

Business Analyst, TAČR

Related services

I also offer this as a standalone service

Let's talk about your project

Book a call

Email · nogolovakristyna@gmail.com